Gold remains one of the world’s most recognised and stable assets — a metal that bridges ancient civilisation and modern finance. Its value stems from unique physical properties, geological scarcity, and a six-thousand-year history of human use across trade, ornament, and reserve systems.
Formation and Characteristics
Gold (chemical symbol Au) forms deep in the Earth’s crust and becomes concentrated in certain regions over long geological periods. These natural processes created the deposits that later became the foundation of mining across continents.
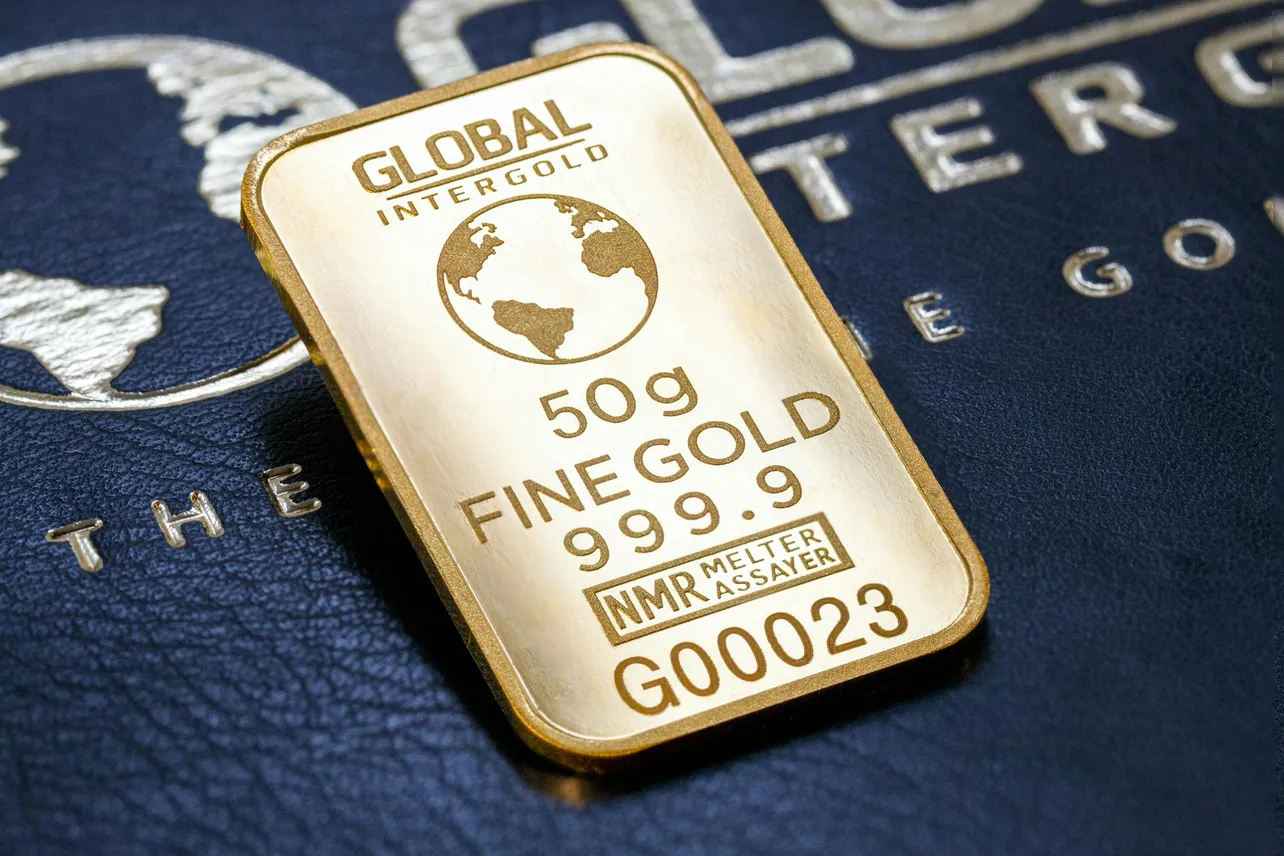
Chemically, gold is dense, non-reactive, and resistant to oxidation — qualities that make it effectively indestructible. Nearly all gold ever mined remains recoverable today. This durability, combined with its malleability and visual appeal, explains why gold still functions as a store of value across cultures and centuries.
Historical Use
The earliest known gold artefacts were discovered in Varna, Bulgaria (4600–4200 BC). By 2600 BC, Egypt had organised mining and trade networks centred on gold ornaments and ingots.
Around 560 BC, the Kingdom of Lydia introduced the first standardised gold coins, establishing the metal’s role in money.
Centuries later, the Gold Standard anchored national currencies to a fixed weight of gold, shaping global finance until its final suspension in 1971.
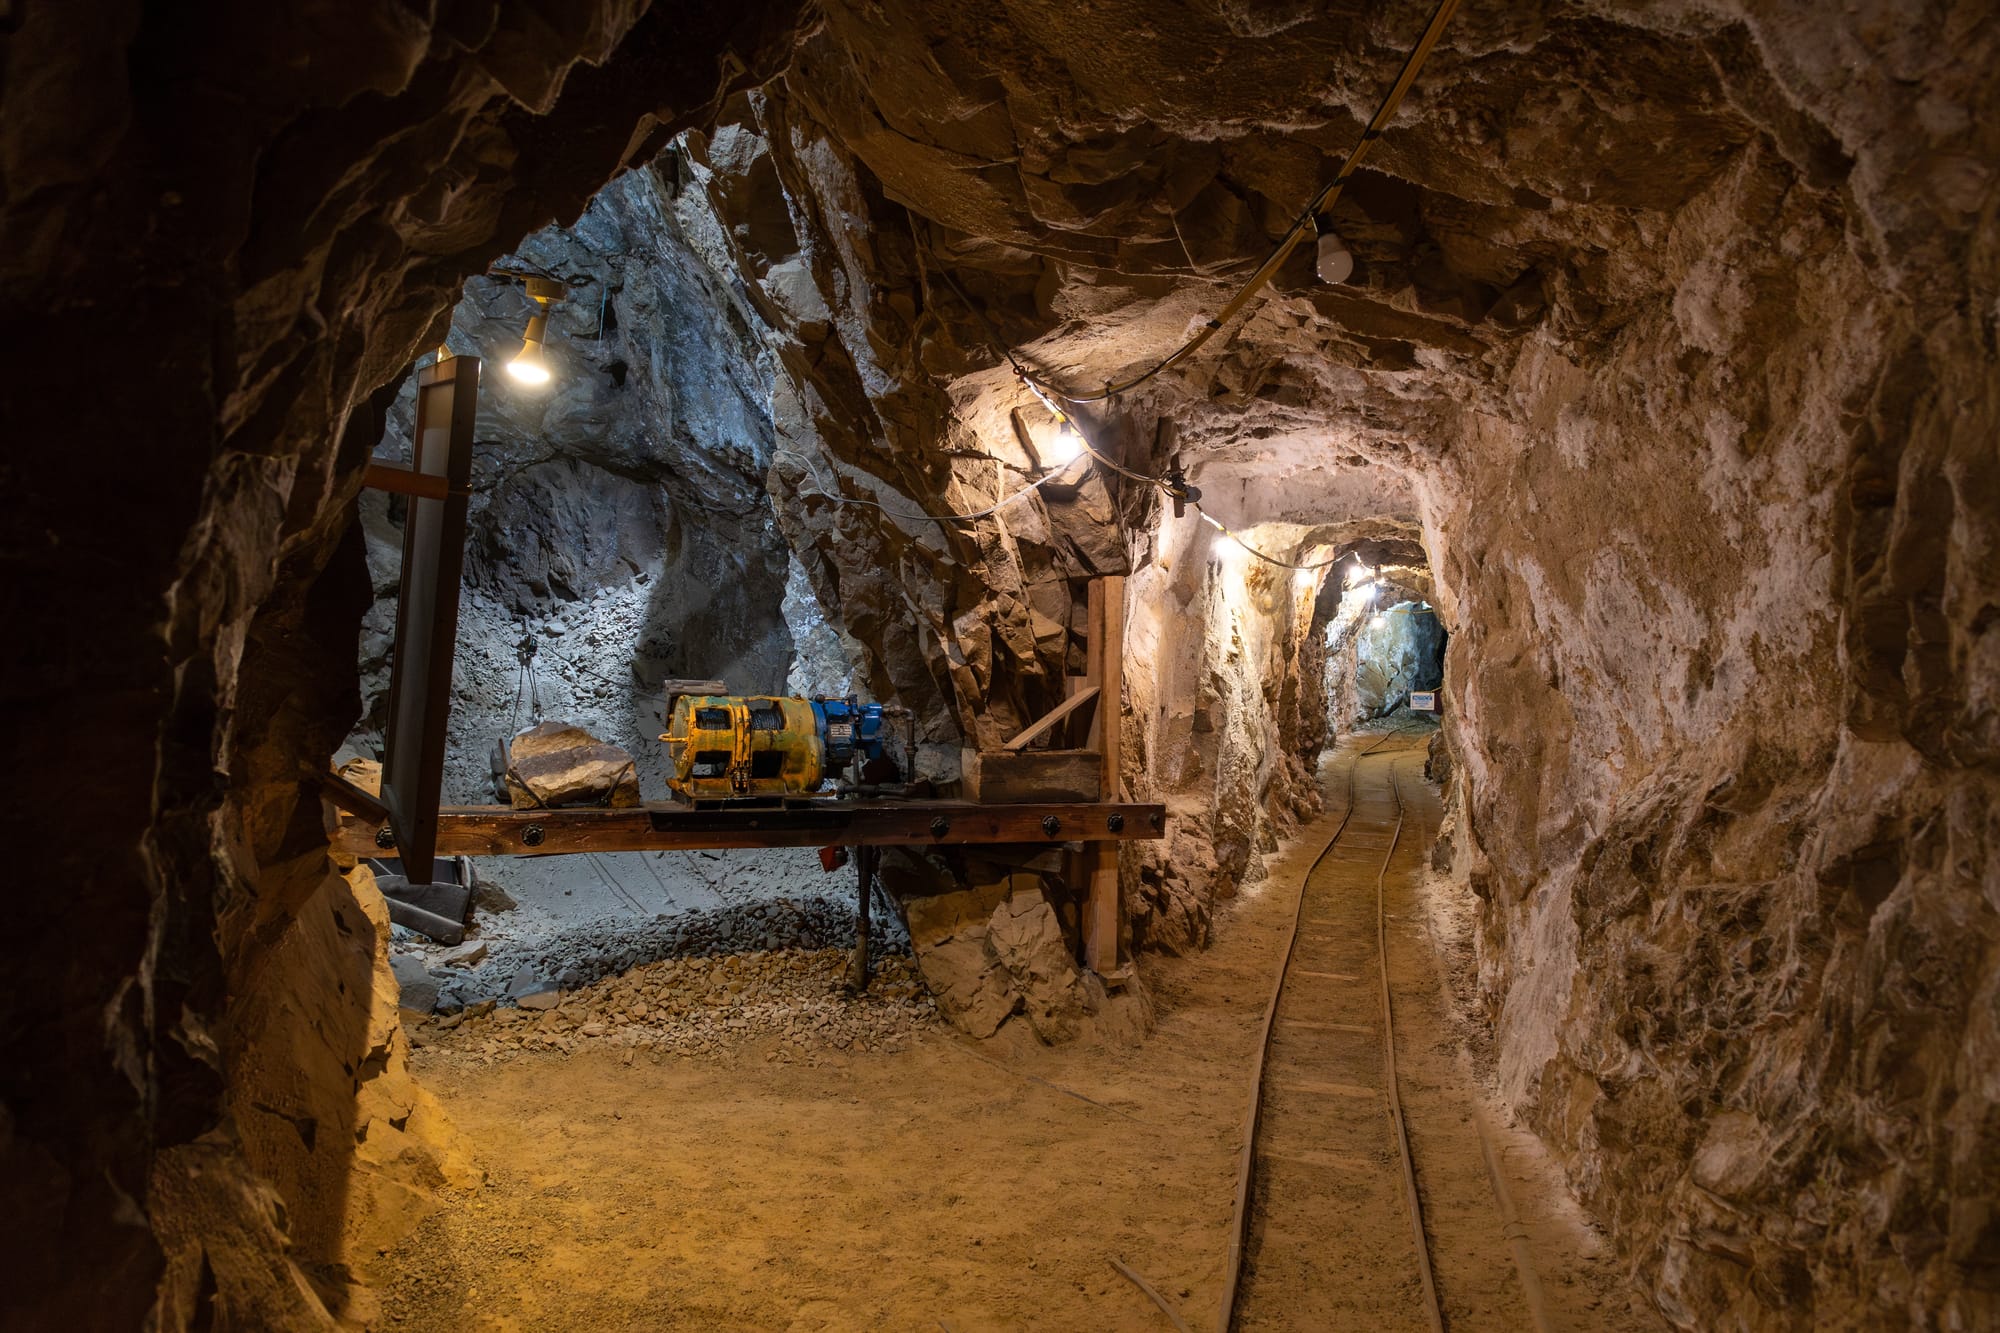
Extraction and Refining
Modern production relies on large-scale open-pit and underground operations. Ore is crushed and processed through cyanide leaching or gravity separation before refining via the Miller or Wohlwill processes — achieving purities up to 99.99%.
According to the U.S. Geological Survey (USGS 2025), world gold mine production was ~3,300 tonnes in 2024 (estimate). China remains the largest producer, followed by Russia, Australia, Canada, and the United States. Major mining regions include Shandong and Henan (China), Siberia (Russia), and Western Australia.
Resource Base
Identified in-ground resources — technically reserves under current economic conditions — total about 64,000 tonnes (USGS 2025).
Russia holds the largest identified reserves (≈12,000 t), followed by Australia (≈11,000 t), South Africa (≈5,000 t), the United States (≈3,000 t), and Indonesia (≈3,600 t).
These reserves form the base for future supply as new discoveries become rarer.
Market Structure
The gold market connects miners, refiners, investors, and central banks through a network of trading hubs.
Spot transactions concentrate in London (LBMA), futures on New York COMEX, and China’s domestic market on the Shanghai Gold Exchange (SGE). Secondary centres include Dubai, Singapore, and Hong Kong.
Supply originates from mining, recycling, and official-sector activity. Demand is driven by jewellery, investment, technology, and central-bank reserves.

Global Holdings
Cumulative above-ground stocks are large relative to annual mine supply and are distributed across jewellery, private investment, and official reserves.
Central banks remain active buyers, with survey data indicating continued interest in diversifying reserves into gold (WGC 2025). Country-level holdings are tracked by WGC/IMF dashboards.
| Rank | Country | Gold Holdings (metric tonnes) |
|---|---|---|
| 1 | United States | 8 133.5 |
| 2 | Germany | 3 351.5 |
| 3 | Italy | 2 451.8 |
| 4 | France | 2 437.0 |
| 5 | Russia | 2 332.7 |
Top five official gold reserve holders (WGC 2025)
Source: World Gold Council, IMF data compiled June 2025.
Price Drivers
Gold prices reflect monetary policy, real interest rates, and risk perception.
Central-bank purchases, ETF flows, and geopolitical uncertainty have supported prices. For example, India’s physically backed gold ETFs reached ~USD 10 billion AUM by late 2025 (Reuters). Real-time sources should be used for current spot levels.
Cultural and Behavioural Dimensions
Academic work (Baur & Lucey, 2010; Baur & McDermott, 2010) classifies gold as a hedge and, in certain market stress, a safe haven.
In India, China, and the Middle East, gold functions as ornament and household savings; purchases spike during events such as Akshaya Tritiya and Lunar New Year.

Environmental and Policy Factors
Artisanal and small-scale mining (ASGM) is material to supply but poses environmental risks. UNEP reporting indicates ~2,094 t of mercury used annually in ASGM (use, not necessarily “released”).
The Minamata Convention and OECD Due Diligence Guidance set standards for responsible sourcing. Large miners increasingly use ESG programmes, hedging, and traceability to manage ecological and financial risk.
Outlook
Global mine output is likely to remain broadly stable through 2030 as mature mines deplete and discoveries decline.
Recycling should take a larger share of supply. Central-bank demand — particularly from emerging markets — is expected to continue.
Technology uses (electronics, renewables) will grow gradually but remain a small share of total demand.
Summary
Gold links geology, trade, and trust. It is mined, refined, and exchanged in a global system that unites physical scarcity with financial perception. Despite shifts in policy, technology, and currency systems, gold endures as a benchmark asset against which value — and uncertainty — are measured.
Sources
- World Gold Council (WGC) – Gold Demand Trends 2024; Mid-Year Outlook 2025; Central Bank Reserves Survey 2025
- U.S. Geological Survey (USGS) – Mineral Commodity Summaries: Gold 2025
- IMF COFER – Official Reserves and Gold Holdings
- London Bullion Market Association (LBMA) – Gold Price Methodology
- Reuters (Oct 2025) – India gold ETFs ~USD 10 bn AUM
- Baur & Lucey (2010) – Financial Review
- Baur & McDermott (2010) – Journal of International Money and Finance
- UNEP / Minamata Convention (2023) – mercury use in ASGM
- OECD (2024) – Due Diligence Guidance for Mineral Supply Chains